
Gold Prices May Fall If Markets Make Good on Bearish Chart Setup – DailyFX
GOLD & CRUDE OIL TALKING POINTS:
- Gold prices may fall if markets make good on bearish chart setup
- Crude oil prices aiming lower, API inventory figures eyed ahead
- US fiscal stimulus negotiations may prove key for risk sentiment
Gold prices briefly touched a new record high just below the $2000/oz figure yesterday but the metal was unable to make meaningful headway upward, finishing the session little-changed. The bounds of the narrow range confining activity over the past week remain unbroken. Crude oil prices edged higher, with the WTI benchmark tracking higher alongside stocks against a broadly risk-on backdrop.
Looking ahead, a quiet offering on the economic data docket may keep sentiment trends at the forefront. A cautiously risk-off tilt is being hinted in bellwether S&P 500 futures. While these early indications are inconclusive for now, gold may struggle if they find follow-through as haven demand buoys the US Dollar and undercuts the appeal of anti-fiat alternatives.
Meanwhile, crude oil might face renewed selling pressure if investors’ disposition darkens. API inventories data will be weighed against expectations of a 2.25-million-barrel outflow from US storage expected to be reported in official EIA statistics on Wednesday. An outcome echoing that projection or even flagging a larger drawdown may limit macro-driven losses.
Ongoing negotiations about the next round of US fiscal stimulus may prove to be pivotal and could inspire sharp acceleration in either the risk-on or -off direction, depending on what transpires. Congress is attempting to reconcile the Democrats’ US$3.5 trillion plan with the Republicans’ US$1 trillion counter-offer. A compromise below $2 trillion may disappoint markets, while a print above it might cheer them.
Recommended by Ilya Spivak
Get Your Free Gold Forecast
GOLD TECHNICAL ANALYSIS
Gold prices put in a bearish Harami candlestick pattern on a test of resistance at 1985.67, the 100% Fibonacci expansion. Negative RSI divergence speaks to ebbing upside momentum and bolsters the case for topping. Initial reversal confirmation on a daily close back below the 78.6% level at 1918.49 exposes the 61.8% Fib at 1865.76 thereafter. Alternatively, a push break of resistance targets the 123.6% expansion at 2059.74.
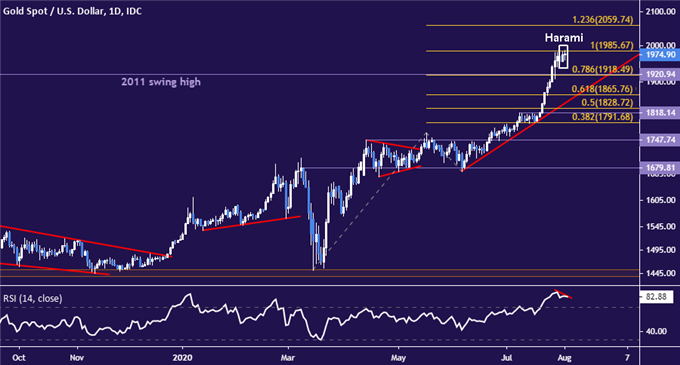
Gold price chart created using TradingView
CRUDE OIL TECHNICAL ANALYSIS
Crude oil prices are languishing in digestion mode but a break through the lower bound of a bearish Rising Wedge chart pattern hints downturn may be ahead. Breaking below support at 34.78 on a daily closing basis may set the stage for a test below the $30/bbl figure. Alternatively, a push up and through resistance in the 42.40-43.88 area looks likely to bring on a test of the $50/bbl handle.
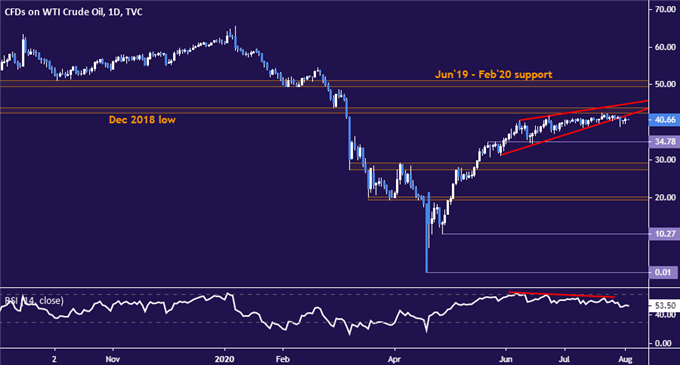
Crude oil price chart created using TradingView

Recommended by Ilya Spivak
Get Your Free Oil Forecast
COMMODITY TRADING RESOURCES
— Written by Ilya Spivak, Head APAC Strategist for DailyFX
To contact Ilya, use the comments section below or @IlyaSpivak on Twitter


